
 @joyboy-yy
dsh-windows-monitor
System monitor overlay for DeepSeek Harness: a corner pill showing live CPU and memory, expanding into disk activity and throughput, per-volume capacity, network state, uptime and battery. Windows collector.
- Stars
- 0
- Language
- TypeScript
- Created
- Oct 16, 2026
- Updated
- Oct 16, 2026
Introduction
dsh-windows-monitor
English | 简体中文


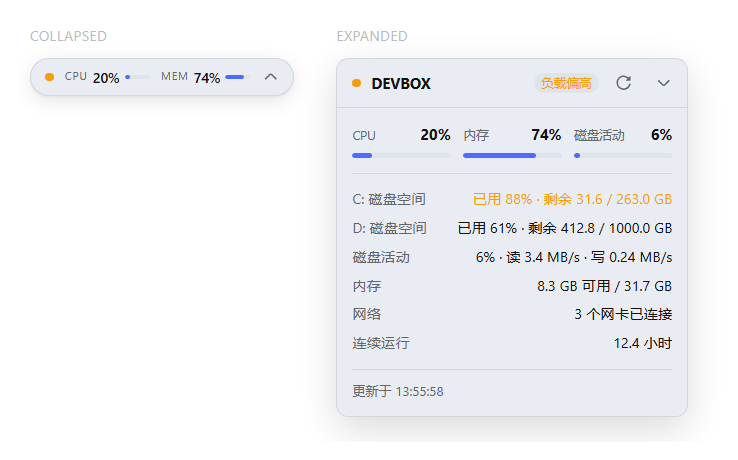
A system monitor overlay for DeepSeek Harness: a compact pill in the bottom-right corner showing live CPU and memory, expanding into a detail card with disk activity and throughput, per-volume capacity, network state, uptime and battery.
Runs on Windows.
Features
- Never covers the middle. Collapsed it is a ~210 px pill; expanded it is a 280 px card. It sits clear of the composer by default.
- Draggable. Drag the pill or the card header anywhere; the position is clamped to the viewport and remembered. A reset control returns it to the corner.
- Live at a glance. The status dot is colour-coded — green nominal, amber elevated, pulsing red for collection failure.
- Detail on demand. CPU, memory and disk activity as bars, plus one row per volume, a memory total, adapter state, uptime and battery.
- Capacity and activity are never conflated. The 磁盘 gauge is busy time — the same figure as Task Manager's own 磁盘 column, computed as
100 − PercentIdleTime. Fullness is a separate per-volume row. A static "93% full" number sitting next to a live CPU reading reads as a stuck or broken dial, so it is never what the gauge shows. - Unknown is a real state. Disk activity is best-effort: with no performance-counter provider, or before the first sample, the panel renders
--rather than0%. A zero would be a claim about an idle disk that nothing actually measured. - Honest failure states. A failed collection shows "unavailable" in the pill instead of stale numbers; a platform with no collector says so explicitly rather than looking broken.
- Theme-native. Every colour is a DSH theme token, so light and dark mode follow the app. Icons are inline SVG from the harness's own icon set — no icon fonts.
- Accessible. Real buttons with labels, visible focus rings, and animations disabled under
prefers-reduced-motion.
Requirements
- DeepSeek Harness with the Web profile and the current profile-bundle system.
- Windows. The host process must be running on Windows; see Platform support.
- Node.js
^22.19.0 || >=24.0.0(to build from source).
No administrator rights are needed, and nothing is installed system-wide.
Platform support
Windows only, and that is deliberate. The plugin is named for Windows, its headline reading (disk activity) comes from a Windows performance counter, and a collector the maintainer cannot run is a collector whose bugs they cannot reproduce. Shipping Linux and macOS collectors that were written from documentation — and that the author could never exercise on their own hardware — traded a promise the project could not keep for two code paths it could not maintain.
The host picks the collector from process.platform, never from the request.
| Platform | Collector |
|---|---|
| Windows | PowerShell + CIM/WMI (Win32_Processor, Win32_OperatingSystem, Win32_LogicalDisk, Win32_Battery, Win32_PerfFormattedData_PerfDisk_PhysicalDisk) and Get-NetAdapter. Verified by the author on Windows 11 |
| Anything else | None. The route answers 501 with an explicit unsupported-platform body, and the panel renders that instead of empty gauges |
linux and macOS collectors did ship in 0.1.0; they were removed in 0.2.0. See the changelog.
CI still runs on all three runners, and that is also deliberate. windows-latest exercises the collector for real, while ubuntu-latest and macos-latest prove the negative contract: with no collector the plugin must answer the error rather than pretend. See .github/workflows/ci.yml.
Known limitations:
- Disk activity needs the Windows performance-counter provider. On a host where it is disabled or missing, the reading degrades to
--instead of failing the snapshot. - The collector pins the process culture to invariant. The fact format is
key=valuewith.as the decimal separator, so a comma-decimal locale would otherwise emit unparseable numbers. - Some drivers report
PercentDiskTimeseveral times above 100, which is why busy time is derived from the idle complement instead.
Install
From npm — prebuilt, and the only path that needs no build permission:
dsh plugin --profile web add dsh-windows-monitor
From a local checkout — this is the path to use while developing:
dsh plugin --profile web add D:\path\to\dsh-windows-monitor
dsh --profile web --dump-config   # confirm the windows-monitor row is composed
dsh --profile web
From a release tarball (prebuilt, no build permission needed):
dsh plugin --profile web add .\dsh-windows-monitor-<version>.tgz
From a pinned source tag — see releases for the current one:
dsh plugin --profile web add github:joyboy-yy/dsh-windows-monitor#v0.2.1
A git install fetches source and runs this package's prepare build, which means package code executes on your machine outside the agent sandbox. pnpm refuses that until the profile's pnpm-workspace.yaml explicitly allows it:
allowBuilds:
  dsh-windows-monitor: true
Read the source and pin a tag before granting that. A release tarball ships prebuilt files and needs no such permission.
Configuration
This bundle inserts one Host/Client row, declared in cordis.patch.yml:
- insert:
    - id: windows-monitor
      name: dsh-windows-monitor
      inject: [shell, sandboxPolicy, webServer]
Override that row in your profile or home cordis.patch.yml to disable it or change its position in the tree.
Browser-local preferences are limited to one value: the dragged panel position, stored under the dsh-windows-monitor:position localStorage key. It is written only when you drag the panel and removed when you press reset. The plugin stores no metrics.
How it works
The Host half registers one read-only route and runs the collector for its own platform through the harness shell service:
GET /api/windows-monitor/snapshot
The collector prints one key=value fact per line. A line format — rather than JSON — is deliberate: emitting correct JSON from PowerShell without assuming a JSON library is a portability trap, whereas key=value is trivial to produce and trivial to parse (and unit-test) on the TypeScript side. The host converts facts into the snapshot the client renders and stamps the timestamp itself.
The shell seam is driven through both of its entry points. DSH renamed ctx.shell.run(spec) to ctx.shell.execute(spec), which resolves with a handle whose result() carries the outcome, so the host prefers execute and falls back to run. Hard-coding either one breaks the plugin on the harness versions that expose the other — 0.2.3 did exactly that and answered every poll with ctx.shell.run is not a function. tests/collectors.test.ts now covers both, plus a seam with neither.
Results are cached for 5 seconds, and concurrent polls share a single in-flight collection instead of racing, so the browser's polling never multiplies collector runs.
The Client half registers into the frame-wide shell.overlay slot. That layer is click-through by design — the panel opts into pointer events, so it never blocks the app underneath.
Neither half touches the model, the session, or the transcript. The plugin registers no tools.
Security model
Read this before installing.
- The collector is read-only. It reads CIM/WMI and runs
Get-NetAdapter. Nothing writes, installs, or changes machine state. - The sandbox grant is broad. The Host half resolves the
danger-full-accesssandbox policy so the shell can run. The commands are read-only, but the policy is not — it is the main thing to review, and it lives insrc/index.tsandsrc/collectors/. - The command is chosen by the host, not the browser. The platform comes from
process.platform; a request cannot select a different collector. - The payload carries no personal data. It contains the host name, CPU percentage, memory totals and usage, per-volume capacity and usage, disk busy time and read/write throughput, a connected-adapter count, uptime hours, and battery percentage when a battery exists. No file contents, no usernames, no paths, no credentials, and no per-process or per-file disk attribution.
- No network egress. The plugin makes no outbound requests. Its only HTTP surface is the local route served by the harness on your machine.
- No secret material. The plugin never reads credentials.
- Cache-Control: no-store on every response.
- One localStorage key, holding only the panel position.
Development
pnpm install
pnpm run typecheck
pnpm run test
pnpm run build
pnpm run test runs the parser suite everywhere plus the collector integration test on Windows. On any other platform it instead asserts the unsupported-platform contract — that selectCollector returns nothing and the route answers 501 rather than serving empty gauges. CI covers both.
pnpm run build produces lib/index.js + lib/index.d.ts (Host, ESM) and lib/client.js + lib/client.js.map (Client, wrapped in the window.__ModuleLoader__ envelope the harness expects).
lib/ is committed on purpose: the harness activates a plugin by reading lib/client.js from disk, and a GitHub install does not necessarily run a build. CI fails if the committed lib/ drifts from a clean build.
The client bundle must never inline React. tsdown.config.ts marks react and react/jsx-runtime as never-bundle so they resolve from the harness module table.
The collector scripts are JavaScript template literals, so a literal ${ would be interpolated at build time and silently corrupt the shell script — tests/collectors.test.ts guards against that. For the same reason a stray backtick inside a script terminates the literal early; that one fails loudly at build time rather than at collection time, so it needs no test.
Contributing
Issues and pull requests are welcome. CONTRIBUTING.md covers the build, test and verification workflow; security-relevant reports go through SECURITY.md.
The scope is intentionally Windows-only, so the most useful contributions are Windows ones: a machine where the performance-counter provider is unavailable, a locale other than en-US or zh-CN, a Windows build where a CIM class behaves differently. A report with the raw key=value output is enough to work from.