
 @juliankang4
dsh-spark-scope
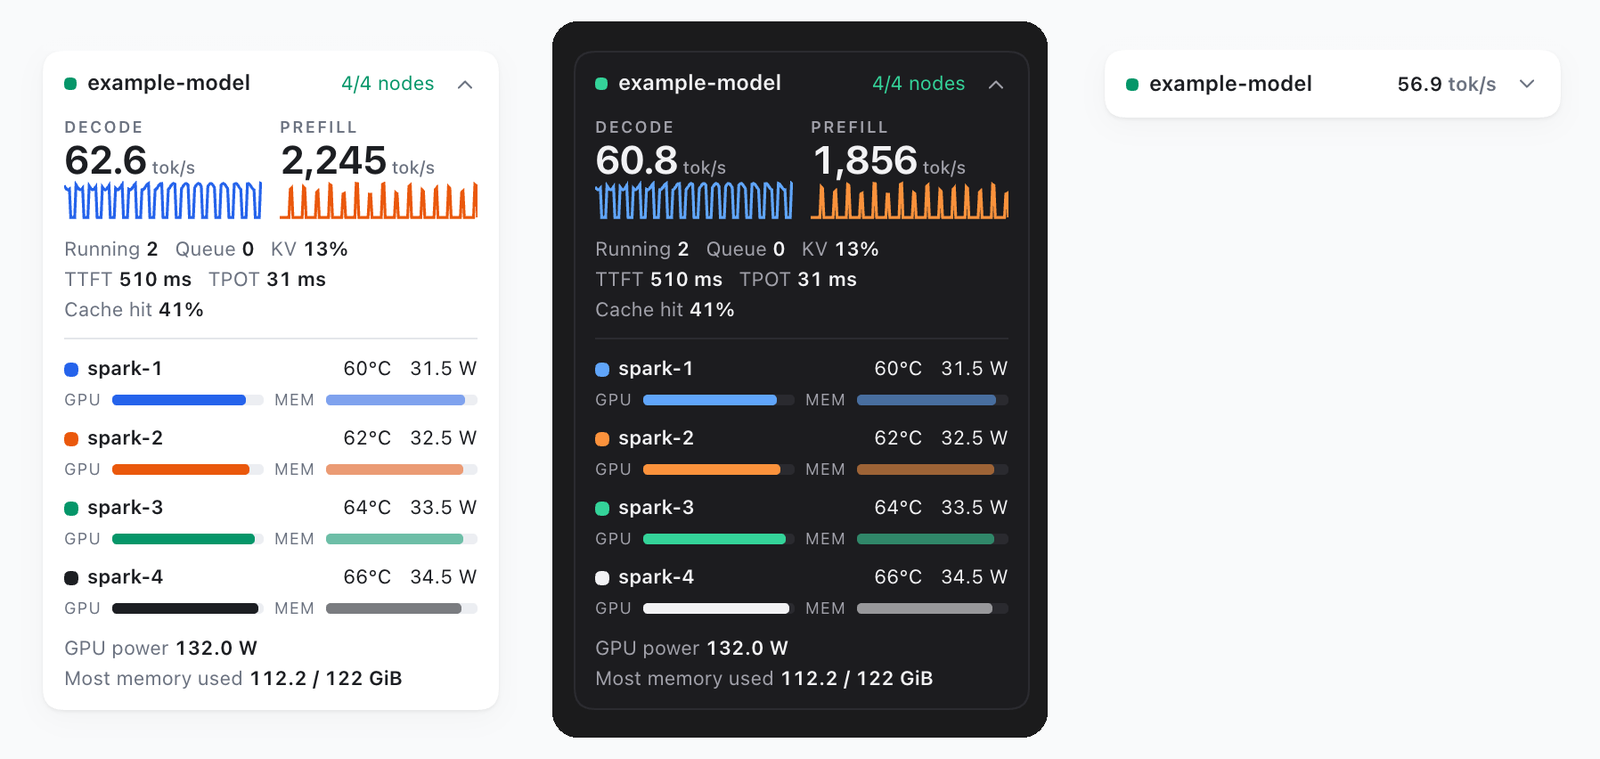
Spark Scope's mini window in the DeepSeek Harness (dsh) sidebar: decode, prefill and every DGX Spark node at a glance
- Stars
- 0
- Language
- TypeScript
- Created
- Oct 7, 2026
- Updated
- Oct 7, 2026
Introduction
dsh-spark-scope
A DeepSeek Harness plugin that puts the Glance view of the Spark Scope mini window in the left sidebar, so you can keep an eye on your DGX Spark nodes and their model server while you work. It works in both the browser (dsh web) and the Desktop app.
Install
dsh plugin --profile web add dsh-spark-scope
In the Desktop app, open Plugins, choose Add plugin, enter dsh-spark-scope and install it.
You also need a running Spark Scope server. See its installation guide.
Set up
Open the Spark Scope tab in Settings, type your Spark Scope dashboard's address and press Enter. Both a local network address like http://spark-scope.local:8787 and a tailnet address like https://spark-scope.example.ts.net work. If you leave out the scheme, http:// is added for you. Clear the field to hide the card. The address can only be changed on the computer that runs dsh; a page opened from another computer shows the field but cannot save it.
The data is fetched by dsh, not by your browser, so the address has to work from the computer that runs dsh. Spark Scope only answers requests made to localhost, an IP address or its own host name. To use any other name, such as a reverse proxy's, add it to SPARK_SCOPE_ALLOWED_HOSTS on the Spark Scope server.
The card
The card sits at the bottom of the sidebar, above other footer items such as the dsh-cost-meter balance. The top of the card shows the model name, how many nodes are responding, and the decode and prefill rates with five-minute sparklines. Below that are running and queued requests, KV cache usage, TTFT and TPOT p95 for the last five minutes and the prefix cache hit rate, followed by a row for each node with its GPU temperature, power draw, load and memory use. If you run more than one model server, the card shows their combined rates and requests, like Spark Scope's "All at once" view.
The dot next to the model name is green when Spark Scope reports the cluster as healthy and orange for any other status. It turns red if Spark Scope stops responding or its data is more than 20 seconds old. A dash (—) means Spark Scope has no reading for that value.
The button in the top right corner collapses the card to a single line with the model name and decode rate, and your browser remembers the setting. The card is hidden while the sidebar is collapsed. It uses the dsh theme and language (English, Chinese, and Korean with dsh-locale-ko) and scales with dsh-ui-scale.
How it reads Spark Scope
The plugin adds a /plugins/dsh-spark-scope/state route to the dsh web server. While the page is visible, the card requests it every 2 seconds, and dsh fetches <address>/api/state with a 5-second timeout. The plugin only reads data and never changes anything on Spark Scope or the nodes. The route uses the same sign-in and Host checks as dsh's own API, so only a signed-in dsh page can read it. dsh ignores any Spark Scope response larger than 2 MB. See dsh's SAFETY.md for running dsh safely.
Configuration
| Field | Default | Description |
|---|---|---|
url | empty | Spark Scope address (http or https). Leave it empty to hide the card. |
The Spark Scope tab in Settings saves this value. You can also set it in the profile's cordis.patch.yml:
- id: spark-scope
  name: dsh-spark-scope
  config:
    url: http://spark-scope.local:8787
Tested with dsh 0.2.0-rc.2 (in Chrome and in the macOS Desktop app) and Spark Scope 0.1.3.